Introduction Hello everyone! Welcome to the first blog of my project14 entry - A LED music visualizer. Since this project is going to be a large one, I'm dividing it into multiple blogs. The first blog will introduce the project and give a basic block diagram of the project as well as talk a little about different types of filters. Then in the next blog, I will implement the filters and do the testing of the project. To reduce the size of the overall project I will be using SMD components and hence the last blog will be the PCB design and the final implementation of the project. Opamps are quite versatile components in electronics. You can do pretty much everything using an opamp - Amplifiers, filters, detectors, rectifiers. You can also do various mathematical operations such as summing, difference, squaring, square root, log, anti-log, etc using opamps. This is what makes them special in analog electronics. You can make a simple analog calculator using opamps!!! I remember reading a book on opamps by Sergio Franco, I believe this book is a standard one and is used in universities all over the world. The author in the preface of the book writes - "If you cannot do it in digital, it's got to be done in analog." So in this project, I'm going to design a LED music visualizer using opamp filters. I will be using active filters for this. An active filter is a filter that uses an active element such as a transistor or an opamp so that it can provide gain in the passband while attenuating the stopband. Here's the basic block diagram of the project -
 The audio spectrum consists of frequencies from 20 Hz to 20 kHz which is
derived from the human audible range. Any good-quality speakers can produce
all these frequencies and give a good sound experience. In this project, the
input audio signal is divided into 3 frequency bands - The lower band, the
mid-band, and the higher band. The lower band frequencies are often called
bass, the mid-band is usually vocals since the voice frequencies of the
human fall between 1kHz - 4kHz, and the higher frequencies are called
treble.
In this project, the input signal is divided into these three bands using
appropriate filters and then the output of these filters is fed to LEDs.
These LEDs will respond to the audio signals and light up accordingly. This
is the basic idea of the music visualizer.
The audio spectrum consists of frequencies from 20 Hz to 20 kHz which is
derived from the human audible range. Any good-quality speakers can produce
all these frequencies and give a good sound experience. In this project, the
input audio signal is divided into 3 frequency bands - The lower band, the
mid-band, and the higher band. The lower band frequencies are often called
bass, the mid-band is usually vocals since the voice frequencies of the
human fall between 1kHz - 4kHz, and the higher frequencies are called
treble.
In this project, the input signal is divided into these three bands using
appropriate filters and then the output of these filters is fed to LEDs.
These LEDs will respond to the audio signals and light up accordingly. This
is the basic idea of the music visualizer.
Filter Basics Here, I will give a basic introduction about filters. A filter is a frequency selective circuit, meaning that it behaves differently for different frequencies and its transfer function is dependent on the input frequency of the signal. The filters shown below are all passive filters, meaning that there is no active element involved and all filters have 0 dB (unity) gain in the passband.
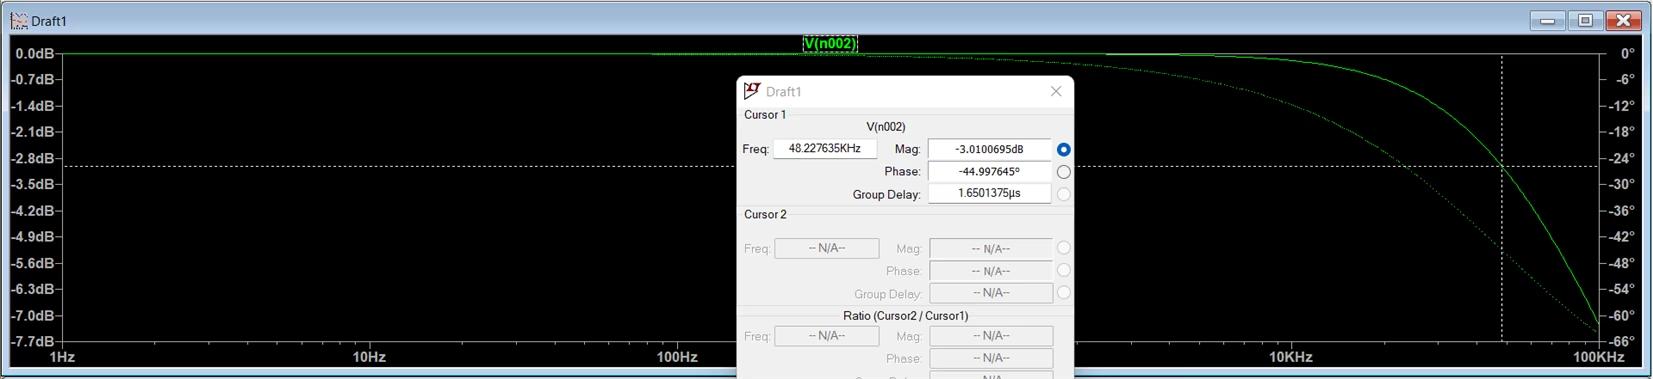
The first one is the RC low pass filter (LPF) - A low pass filter is one that allows frequencies below the cutoff to pass (passband) and attenuates the frequencies above the cutoff freq. A simple RC filter is simulated using LTspice and the results are shown below - The RC filter has a cutoff freq given by the formula fc = 1/(2*pi*R*C) For the filter below, fc = 48.2 kHz. The same can be observed from the gain vs frequency plots of the simulated results. The cutoff freq is where the gain drops by 3dB i.e. -3db for a passive filter with a gain of 0dB
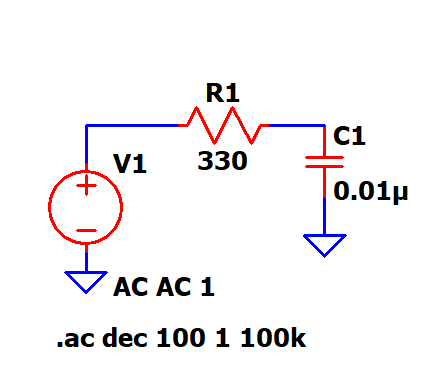
 The cutoff from the simulation is 42.22 kHz very close to the mathematical
value.
The cutoff from the simulation is 42.22 kHz very close to the mathematical
value.
High Pass Filter Next is a high pass filter (HPF), a HPF attenuates the frequencies below the cutoff and allows the frequencies above the cutoff, which means the filter response is exactly the opposite of LPF. The below circuit is an example for RC HPF along with the simulated results. One thing to note here is that the formula to calculate the cutoff freq remains the same, only the passband and stopband get exchanged. The positions of the R and C are exchanged to form an HPF from LPF with the same cutoff freq.
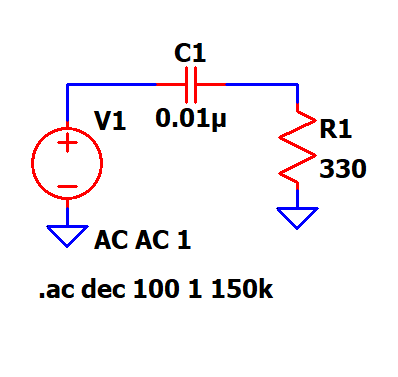
 Here in the gain vs freq plot, it can be observed that the gain is less in
the stopband and the gain increases as the freq increases. Beyond the
cutoff, the gain increases and reaches to 0dB.
Here in the gain vs freq plot, it can be observed that the gain is less in
the stopband and the gain increases as the freq increases. Beyond the
cutoff, the gain increases and reaches to 0dB.
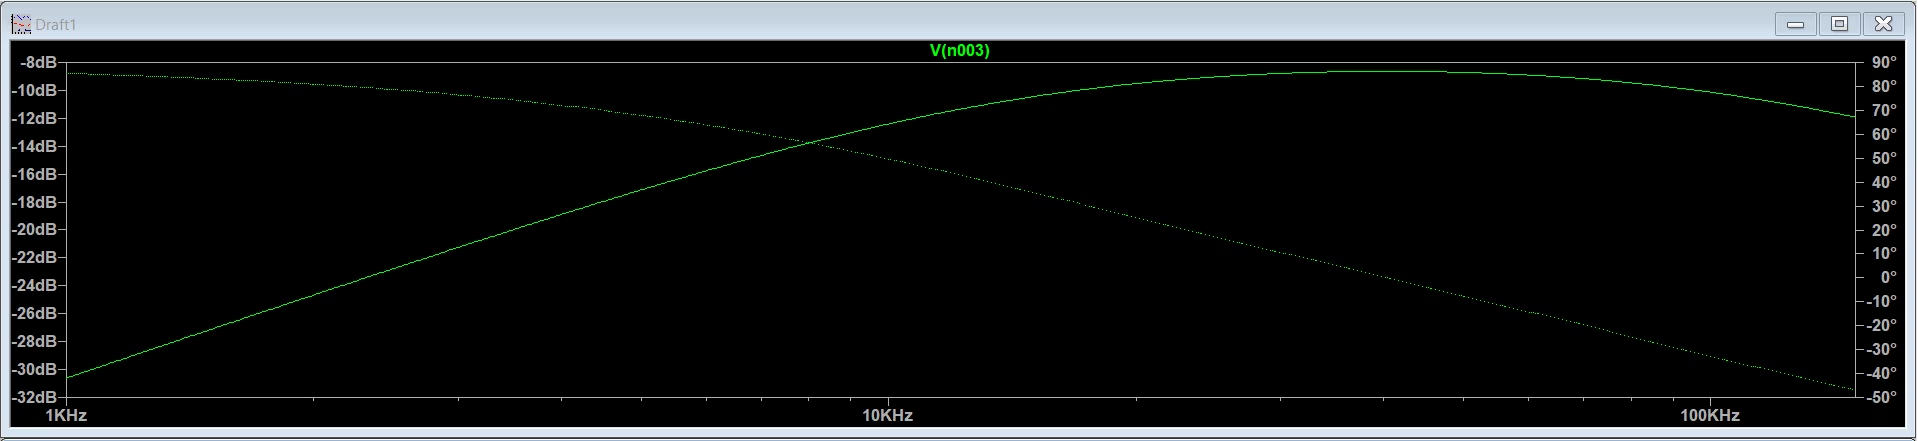
Band Pass Filter The last filter which I'll be using is the bandpass filter. As the name suggests, a bandpass filter (BPF) allows only a certain band of frequencies to pass through them while blocking all the out-of-band frequencies. A BPF can be formed by combining the HPF and LPF with two different cutoffs. The first stage of the BPF is an HPF such that it allows all the frequencies above f1 and the second stage is an LFP which blocks all the frequencies below f2 such that f2 > f1. Below is an example of a BPF along with its gain vs freq plot.
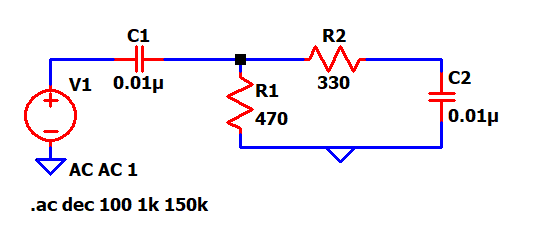 As seen above, the gain first increases and then again starts to decrease
with an increase in frequency. The gain is maxed in the middle band of the
cutoff frequencies.
All the filters above, are passive in nature and have no gain at all. Just
for an example, I have also simulated an active filter using opamp which
provides a certain amount of gain in the passband. This is helpful if you
want to drive a load or feed the output signal of a filter to another stage.
With no gain, the filtered output is of not much use.
As seen above, the gain first increases and then again starts to decrease
with an increase in frequency. The gain is maxed in the middle band of the
cutoff frequencies.
All the filters above, are passive in nature and have no gain at all. Just
for an example, I have also simulated an active filter using opamp which
provides a certain amount of gain in the passband. This is helpful if you
want to drive a load or feed the output signal of a filter to another stage.
With no gain, the filtered output is of not much use.
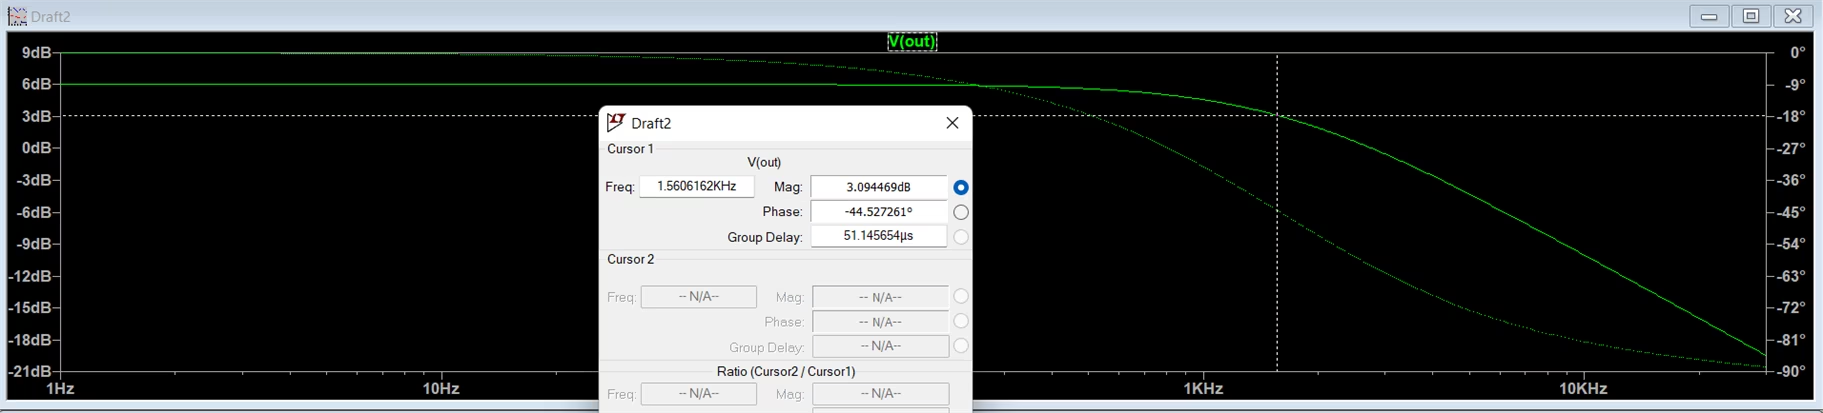
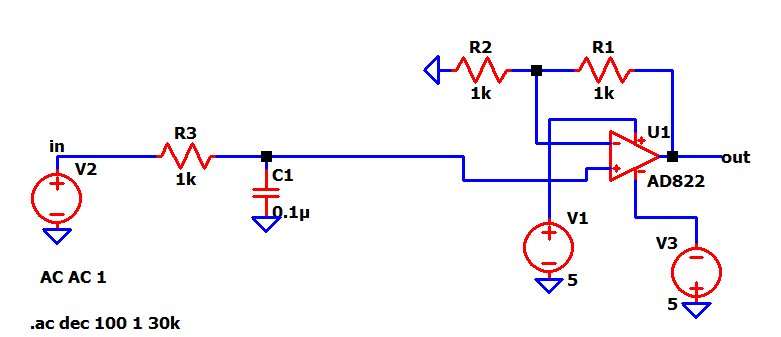 In the above circuit, the low pass filter has a cutoff freq of 1.59 kHz and
the filtered signal is fed at the input of a non-inverting opamp amplifier
to amplify the signal. From the gain vs freq plot, it can be observed that
the cutoff of the signal remains the same but the max gain has improved by a
factor of 2 or 6 dB.
In the above circuit, the low pass filter has a cutoff freq of 1.59 kHz and
the filtered signal is fed at the input of a non-inverting opamp amplifier
to amplify the signal. From the gain vs freq plot, it can be observed that
the cutoff of the signal remains the same but the max gain has improved by a
factor of 2 or 6 dB.
 Now that we have built upon the basics of filters and active filters using
opamps, it's time to do some calculations for our required filters and test
the circuit.
In the next blog, I will test each filter separately and then combine all
the filters to build the entire project.
Now that we have built upon the basics of filters and active filters using
opamps, it's time to do some calculations for our required filters and test
the circuit.
In the next blog, I will test each filter separately and then combine all
the filters to build the entire project.
