 In the example above, I’ve configured my logging as follows:
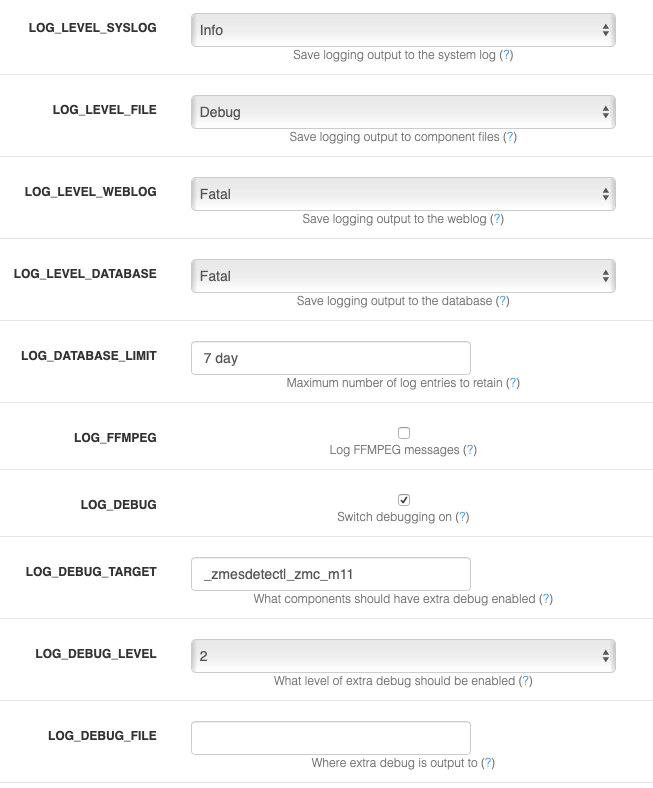
LOG_DEBUG” - ZoneMinder components usually support debug logging available to help with diagnosing problems. Binary components have several levels of debug whereas more other components have only one. Normally this is disabled to minimise performance penalties and avoid filling logs too quickly. This option lets you switch on other options that allow you to configure additional debug information to be output. Components will pick up this instruction when they are restarted.
LOG_DEBUG_TARGET - There are three scopes of debug available. Leaving this option blank means that all components will use extra debug (not recommended). Setting this option to ‘_
LOG_DEBUG_LEVEL - There are 9 levels of debug available, with higher numbers being more debug and level 0 being no debug. However not all levels are used by all components. Also if there is debug at a high level it is usually likely to be output at such a volume that it may obstruct normal operation. For this reason you should set the level carefully and cautiously until the degree of debug you wish to see is present. Scripts and the web interface only have one level so this is an on/off type option for them.
LOG_DEBUG_FILE - This option allows you to specify a different target for debug output. All components have a default log file which will norally be in /tmp or /var/log and this is where debug will be written to if this value is empty. Adding a path here will temporarily redirect debug, and other logging output, to this file. This option is a simple filename and you are debugging several components then they will all try and write to the same file with undesirable consequences. Appending a ‘+’ to the filename will cause the file to be created with a ‘.
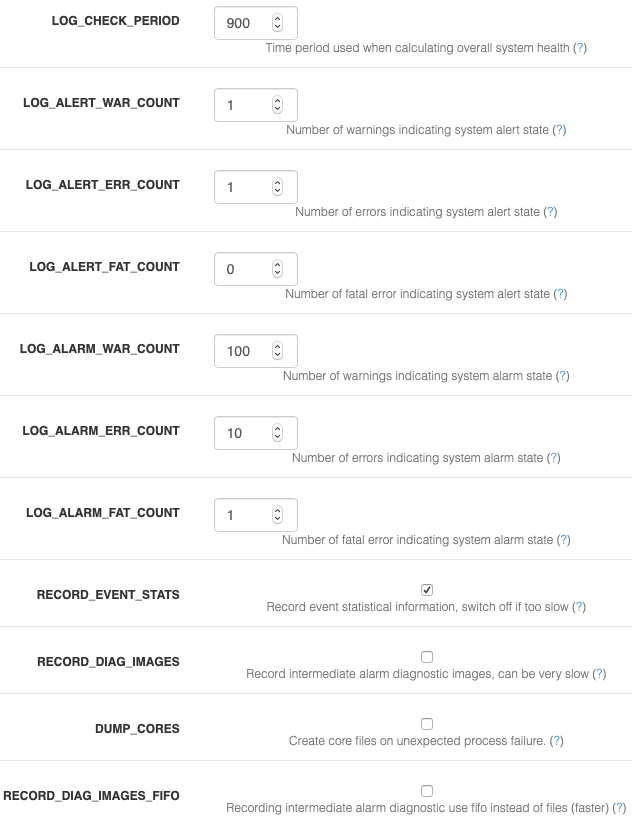
LOG_CHECK_PERIOD - When ZoneMinder is logging events to the database it can retrospectively examine the number of warnings and errors that have occurred to calculate an overall state of system health. This option allows you to indicate what period of historical events are used in this calculation. This value is expressed in seconds and is ignored if LOG_LEVEL_DATABASE is set to None.
LOG_ALERT_WAR_COUNT - When ZoneMinder is logging events to the database it can retrospectively examine the number of warnings and errors that have occurred to calculate an overall state of system health. This option allows you to specify how many warnings must have occurred within the defined time period to generate an overall system alert state. A value of zero means warnings are not considered. This value is ignored if LOG_LEVEL_DATABASE is set to None.
LOG_ALERT_ERR_COUNT - When ZoneMinder is logging events to the database it can retrospectively examine the number of warnings and errors that have occurred to calculate an overall state of system health. This option allows you to specify how many errors must have occurred within the defined time period to generate an overall system alert state. A value of zero means errors are not considered. This value is ignored if LOG_LEVEL_DATABASE is set to None.
LOG_ALERT_FAT_COUNT - When ZoneMinder is logging events to the database it can retrospectively examine the number of warnings and errors that have occurred to calculate an overall state of system health. This option allows you to specify how many fatal errors (including panics) must have occurred within the defined time period to generate an overall system alert state. A value of zero means fatal errors are not considered. This value is ignored if LOG_LEVEL_DATABASE is set to None.
LOG_ALARM_WAR_COUNT - When ZoneMinder is logging events to the database it can retrospectively examine the number of warnings and errors that have occurred to calculate an overall state of system health. This option allows you to specify how many warnings must have occurred within the defined time period to generate an overall system alarm state. A value of zero means warnings are not considered. This value is ignored if LOG_LEVEL_DATABASE is set to None.
LOG_ALARM_ERR_COUNT - When ZoneMinder is logging events to the database it can retrospectively examine the number of warnings and errors that have occurred to calculate an overall state of system health. This option allows you to specify how many errors must have occurred within the defined time period to generate an overall system alarm state. A value of zero means errors are not considered. This value is ignored if LOG_LEVEL_DATABASE is set to None.
LOG_ALARM_FAT_COUNT - When ZoneMinder is logging events to the database it can retrospectively examine the number of warnings and errors that have occurred to calculate an overall state of system health. This option allows you to specify how many fatal errors (including panics) must have occurred within the defined time period to generate an overall system alarm state. A value of zero means fatal errors are not considered. This value is ignored if LOG_LEVEL_DATABASE is set to None.
RECORD_EVENT_STATS - This version of ZoneMinder records detailed information about events in the Stats table. This can help in profiling what the optimum settings are for Zones though this is tricky at present. However in future releases this will be done more easily and intuitively, especially with a large sample of events. The default option of ‘yes’ allows this information to be collected now in readiness for this but if you are concerned about performance you can switch this off in which case no Stats information will be saved.
RECORD_DIAG_IMAGES - In addition to recording event statistics you can also record the intermediate diagnostic images that display the results of the various checks and processing that occur when trying to determine if an alarm event has taken place. There are several of these images generated for each frame and zone for each alarm or alert frame so this can have a massive impact on performance. Only switch this setting on for debug or analysis purposes and remember to switch it off again once no longer required.
RECORD_DIAG_IMAGES_FIFO - Adds fifo options for diagnostic images for much lower impact diagnostics mode. Diagnostic images are only written when there is a client (like a web browser) listening for them. If there is no active client connected, FIFO images are skipped. Note that this feature also needs RECORD_DIAG_IMAGES to be on. Note: Your monitor needs to be in some recording mode (modect/mocord/etc.) In addition to creating diagnostic images, this feature also adds a json stream for the detection data so you can see in real time the pixels or blobs detected for the motion. This allows for easy real time stream of both delta and reference images (as video streams) along with the detection numbers. Once you turn on RECORD_DIAG_IMAGES and the new RECORD_DIAG_IMAGES_FIFO in the logging options you can then use 3 new remote stream urls:
- The delta images as an MJPEG stream (great to see where it is seeing the motion!):
https://portal/zm/cgi-bin/nph-zms?mode=jpeg&bitrate=2&buffer=0&source=fifo&format=delta&monitor=1&maxfps=5&
(change monitor, portal to your values. could be &user=user&pass=pass or &auth=authval or &token=access_token) - The reference images as an MJPEG stream: https://portal/zm/cgi-bin/nph -zms?mode=jpeg&bitrate=2&buffer=0&source=fifo&format=referen ce&monitor=1&maxfps=5&
(change monitor, portal to your values. could be &user=user&pass=pass or &auth=authval or &token=access_token) - text json raw stream: https://portal/zm/cgi-bin/nph-zms? &buffer=0&source=fifo&format=raw&monitor=1&
(change monitor , portal to your values, could be &user=user&pass=pass or &auth=authval or &token=access_token) - The reference images as an MJPEG stream: https://portal/zm/cgi-bin/nph -zms?mode=jpeg&bitrate=2&buffer=0&source=fifo&format=referen ce&monitor=1&maxfps=5&
DUMP_CORES - When an unrecoverable error occurs in a ZoneMinder binary process is has traditionally been trapped and the details written to logs to aid in remote analysis. However in some cases it is easier to diagnose the error if a core file, which is a memory dump of the process at the time of the error, is created. This can be interactively analysed in the debugger and may reveal more or better information than that available from the logs. This option is recommended for advanced users only otherwise leave at the default. Note using this option to trigger core files will mean that there will be no indication in the binary logs that a process has died, they will just stop, however the zmdc log will still contain an entry. Also note that you may have to explicitly enable core file creation on your system via the ‘ulimit -c’ command or other means otherwise no file will be created regardless of the value of this option.