ESP32 Weather Station
From: https://www.instructables.com/DIY-Weather-Station-With-ESP32/
DIY Weather Station With ESP32
By Giovanni Aggiustatutto in CircuitsElectronics
 Introduction: DIY Weather Station With ESP32
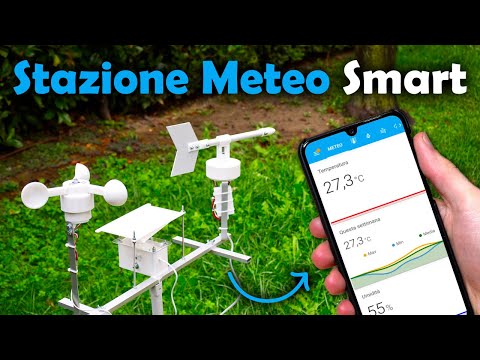
Hello! Today we are going to look at this smart weather station I built. The
weather station I built measures temperature, humidity, air pressure, wind
speed and direction, and the amount of rain that falls. All the data is
collected by an ESP32, which is a kind of Arduino, and via wifi it is sent
to the mobile app. On the app, or on the web page, we can see real-time data
from the weather station and graphs, for example of the temperature, with
minimum and maximum of every day, and the pressure graph, which we can use
to make a rough weather forecast. If this sounds difficult, don't worry, in
this guide you can find all the informations.
To see more details about the construction, watch the video on YouTube (it
is in Italian but it has English subtitles).
Introduction: DIY Weather Station With ESP32
Hello! Today we are going to look at this smart weather station I built. The
weather station I built measures temperature, humidity, air pressure, wind
speed and direction, and the amount of rain that falls. All the data is
collected by an ESP32, which is a kind of Arduino, and via wifi it is sent
to the mobile app. On the app, or on the web page, we can see real-time data
from the weather station and graphs, for example of the temperature, with
minimum and maximum of every day, and the pressure graph, which we can use
to make a rough weather forecast. If this sounds difficult, don't worry, in
this guide you can find all the informations.
To see more details about the construction, watch the video on YouTube (it
is in Italian but it has English subtitles).
Supplies
To build the weahter station, we will need:
ESP32 board with external wifi antenna
micro usb cable
plastic box for the electronics
DHT22 temperature and humidity sensor
BMP180 pressure sensor
various wires and cables
3D printer white filament
5v to 3,3v level shifters
6 Hall effect sensors
perfboard
M4 and M5 threaded rods
M4 and M5 bolts and nuts
and a lot of other things i forgot to add to the list!
Tools:
- 3D printer
- soldering iron
- drill
- hot glue
- computer
Also, to connect the project to the app you need to have Home Assistant
running on a raspberry pi or on a computer. If you don't have Home Assistant
you can connect the weather station to Blynk, but you need to write the code
for it. If you write the code for Blynk, if you like you can share it so
others can use it.
Step 1: Temperature Sensor
 Temperature Sensor
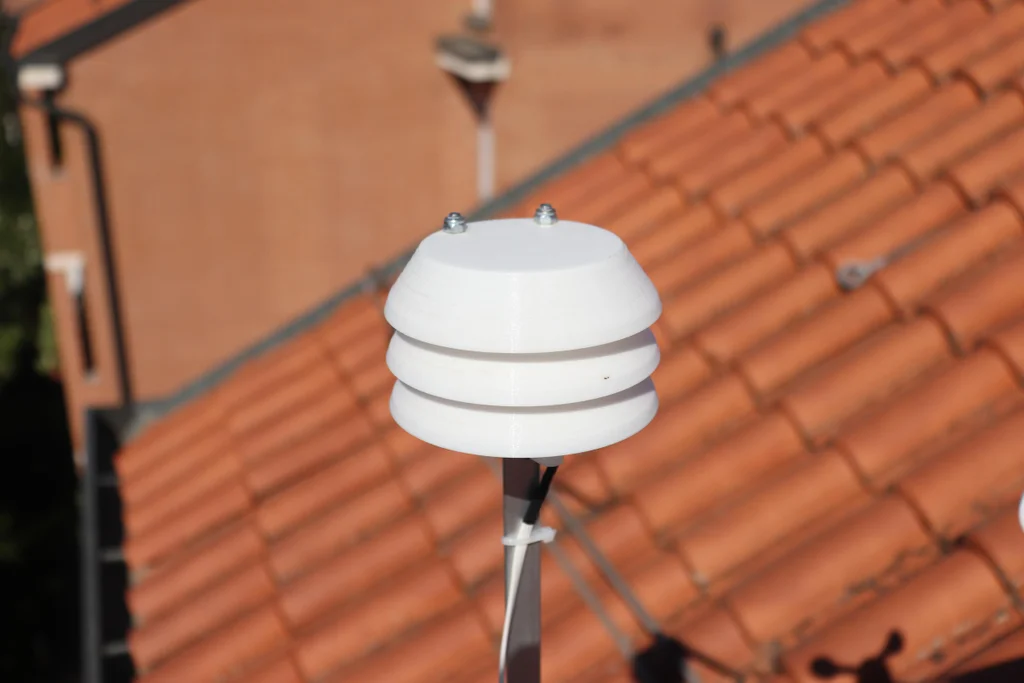
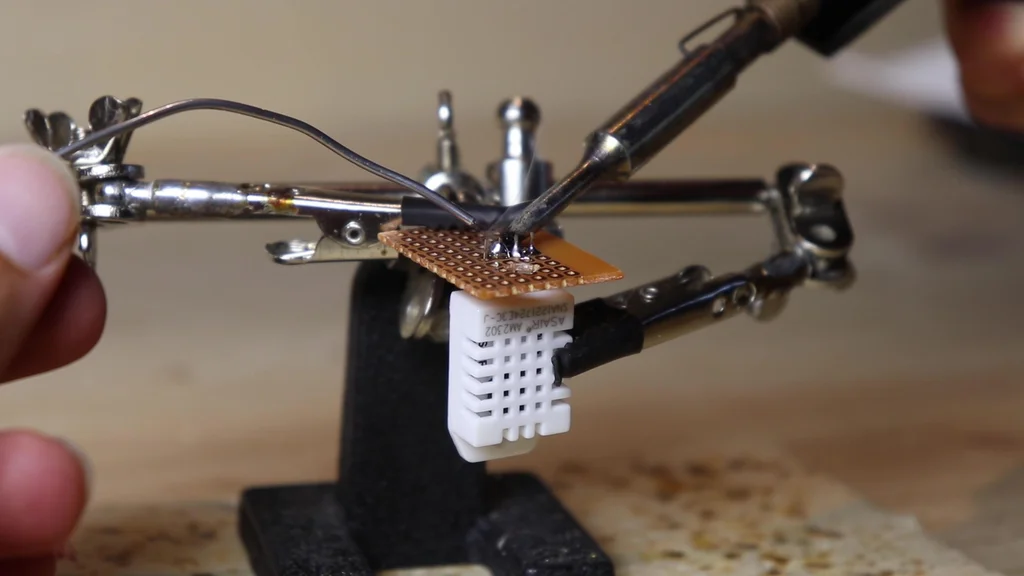
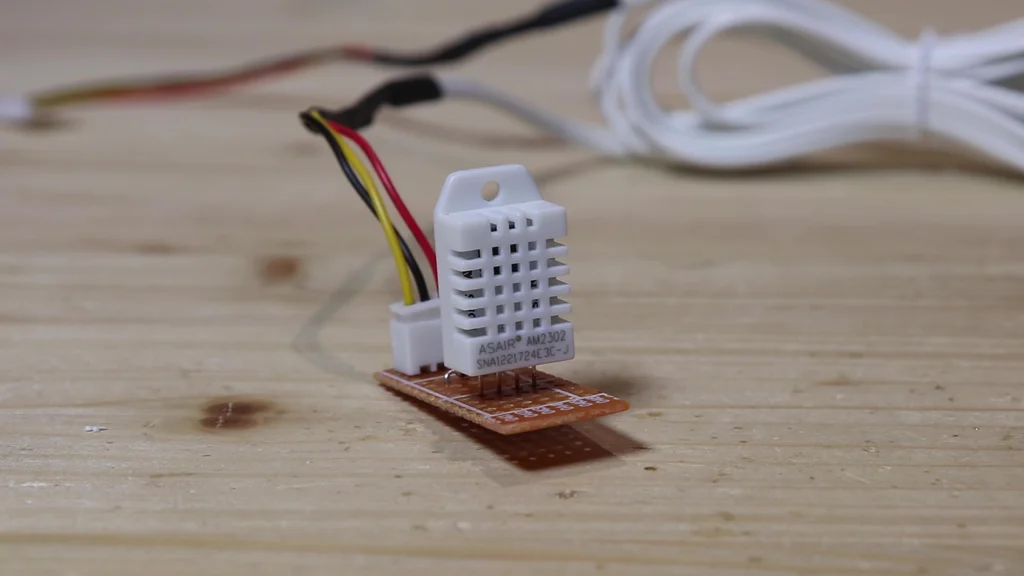
To measure temperature and humidity I will use the DHT22 sensor. I soldered
the sensor onto a perfboard, with a connector and a pull-up resistor between
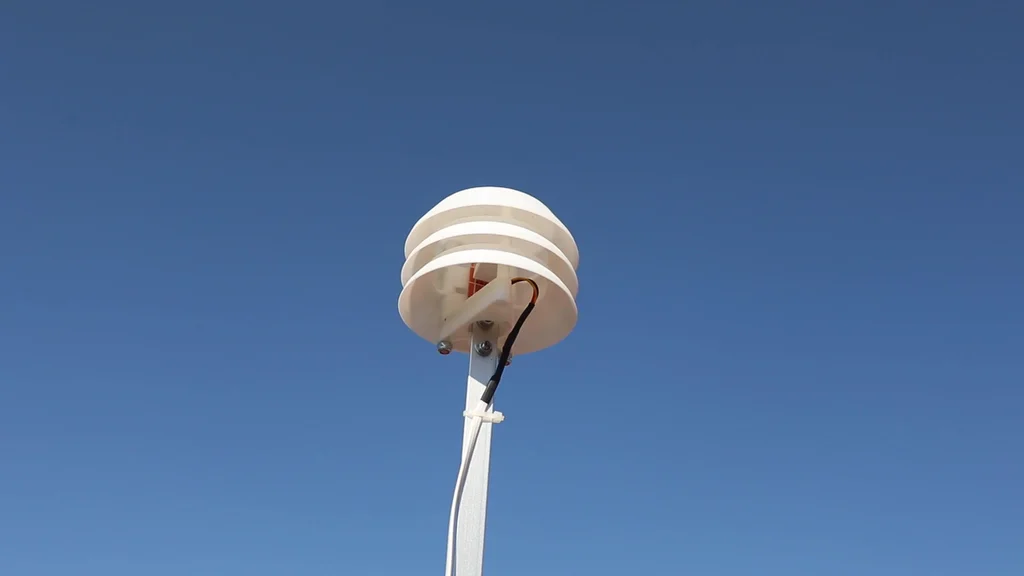
3,3v and the signal pin. I put the sensor inside a Stevenson screen. The
Stevenson screen protects the sensor from direct sun and rain, while
allowing air to pass through. By avoiding the sun to heat the sensor, it
allows to get more accurate temperature readings. To build it, I 3D printed
all the parts, and attached them togheter with two threaded rods. I glued
the perfboard with the sensor inside the Stevenson screen, and underneath I
put the bracket that will hold the sensor up.
Down here you can find all the 3d printable files for the Stevenson screen.
Stevenson Screen 3
Attachments
Temperature Sensor
To measure temperature and humidity I will use the DHT22 sensor. I soldered
the sensor onto a perfboard, with a connector and a pull-up resistor between
3,3v and the signal pin. I put the sensor inside a Stevenson screen. The
Stevenson screen protects the sensor from direct sun and rain, while
allowing air to pass through. By avoiding the sun to heat the sensor, it
allows to get more accurate temperature readings. To build it, I 3D printed
all the parts, and attached them togheter with two threaded rods. I glued
the perfboard with the sensor inside the Stevenson screen, and underneath I
put the bracket that will hold the sensor up.
Down here you can find all the 3d printable files for the Stevenson screen.
Stevenson Screen 3
Attachments
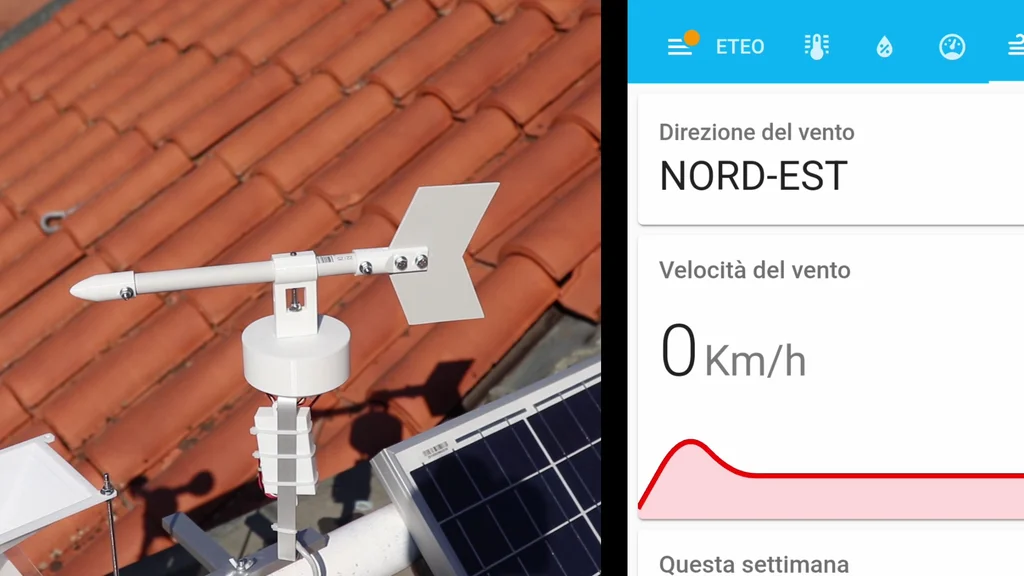
Step 2: Wind Vane
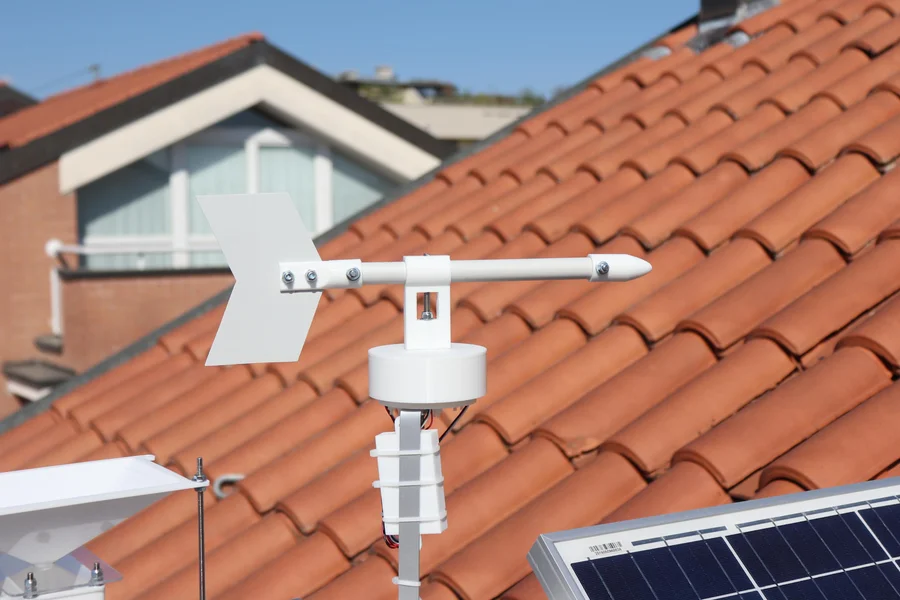
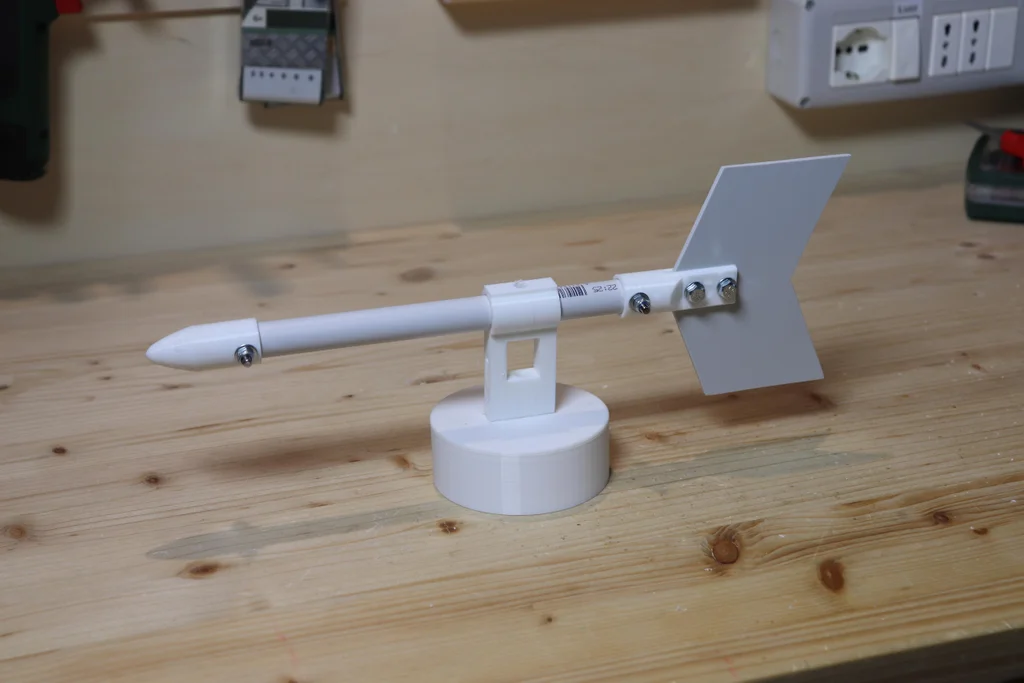
 Then we have the wind vane, which detects which direction the wind is coming
from. Also for this one I had to make some parts with the 3D printer. The wind
vane has this arrow-shaped piece at the back and the tip at the front, with a
bolt inside as a weight to balance it. The flag can rotate freely with a ball
bearing that I put in the base. To detect the 4 cardinal points from which the
wind comes (north, east, south, west) I will use 4 hall effect sensors, which
are magnetic sensors that are activated when a magnet approaches.
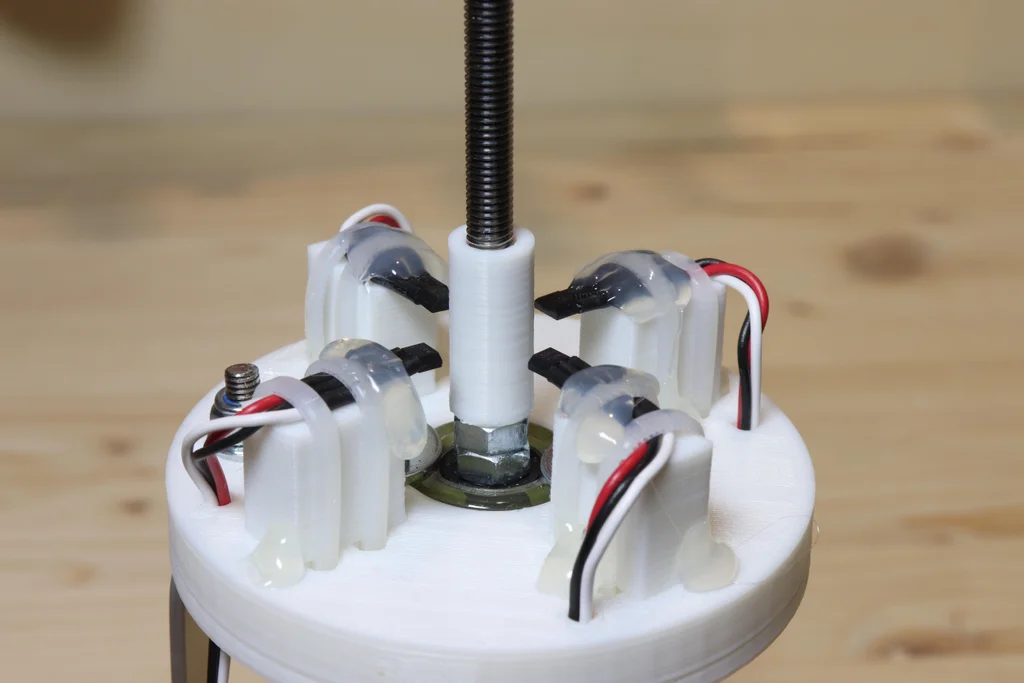
My idea is to put the hall sensors like shown in the second photo, with the
magnet spinning and activating the sensor of the cardinal point towards
which the flag is turned. For intermediate points, e.g. north-east, the two
corresponding sensors (north and east) will be activated. I have placed the
magnetic sensors here on the base of the wind vane, raised of about 1 cm to
keep them away from the metal bolts which can attract the magnet. On the
upper part, that is free to rotate, I glued the magnet. This piece also has
the function of protecting the sensors from the rain. I inserted the actual
wind vane onto the threaded rod, and secured it with a self-locking nut. The
hall sensors each have 3 wires, which go to their original board with the
little LED, which is useful to see if the sensors work correctly. I soldered
the four boards onto a perfboard. From there I used an old network cable to
bring gnd and 5v to the sensors and the four signal pins to the main board,
which we will see later. I put the four sensor's boards in this 3d printed
box, with a piece of acrylic on top.
Then we have the wind vane, which detects which direction the wind is coming
from. Also for this one I had to make some parts with the 3D printer. The wind
vane has this arrow-shaped piece at the back and the tip at the front, with a
bolt inside as a weight to balance it. The flag can rotate freely with a ball
bearing that I put in the base. To detect the 4 cardinal points from which the
wind comes (north, east, south, west) I will use 4 hall effect sensors, which
are magnetic sensors that are activated when a magnet approaches.
My idea is to put the hall sensors like shown in the second photo, with the
magnet spinning and activating the sensor of the cardinal point towards
which the flag is turned. For intermediate points, e.g. north-east, the two
corresponding sensors (north and east) will be activated. I have placed the
magnetic sensors here on the base of the wind vane, raised of about 1 cm to
keep them away from the metal bolts which can attract the magnet. On the
upper part, that is free to rotate, I glued the magnet. This piece also has
the function of protecting the sensors from the rain. I inserted the actual
wind vane onto the threaded rod, and secured it with a self-locking nut. The
hall sensors each have 3 wires, which go to their original board with the
little LED, which is useful to see if the sensors work correctly. I soldered
the four boards onto a perfboard. From there I used an old network cable to
bring gnd and 5v to the sensors and the four signal pins to the main board,
which we will see later. I put the four sensor's boards in this 3d printed
box, with a piece of acrylic on top.
Step 3: Anemometro
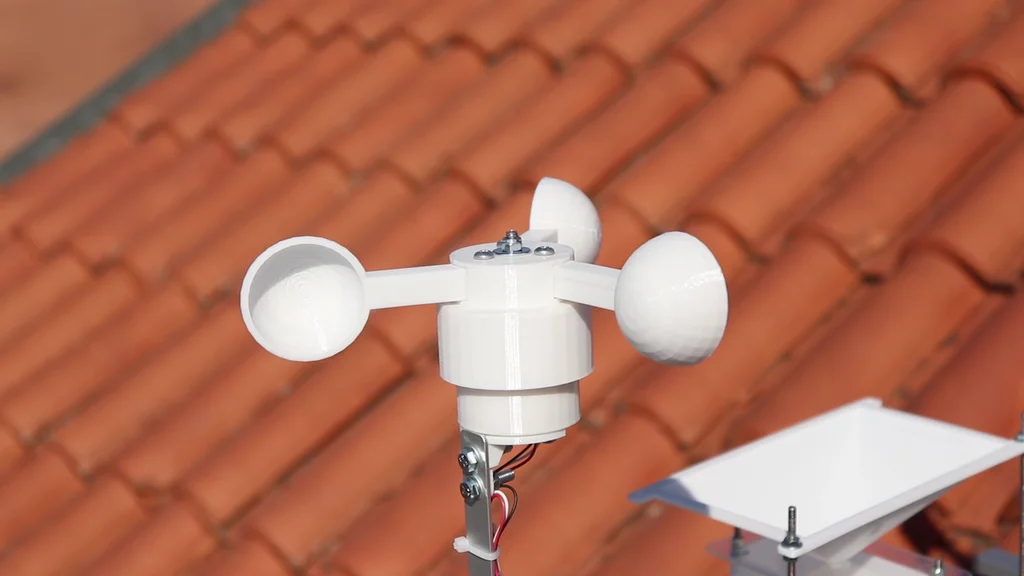
 Now comes the anemometer. I already talked about this in a video last year,
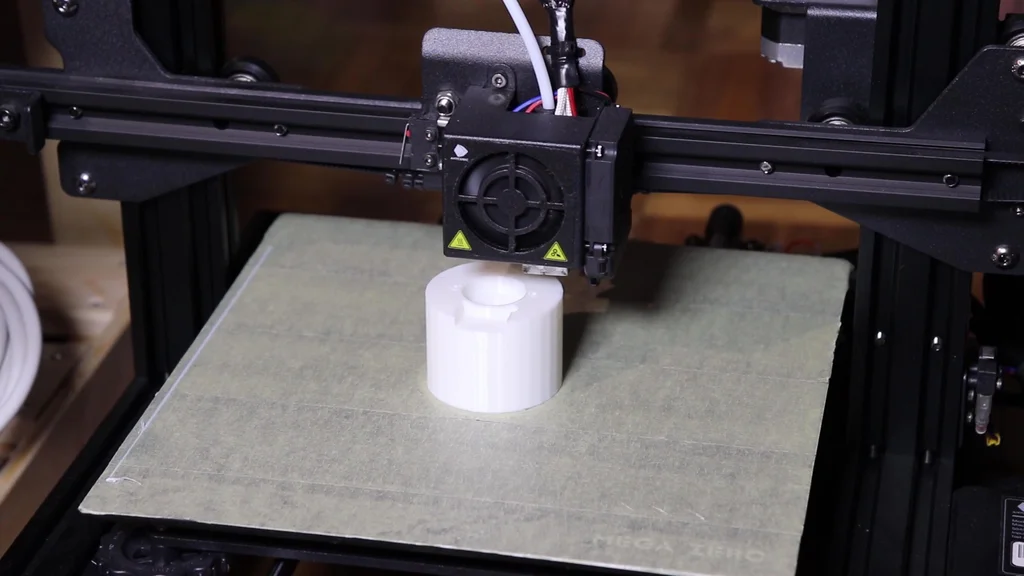
which you can find here. I also made the anemometer with the 3D printer, and
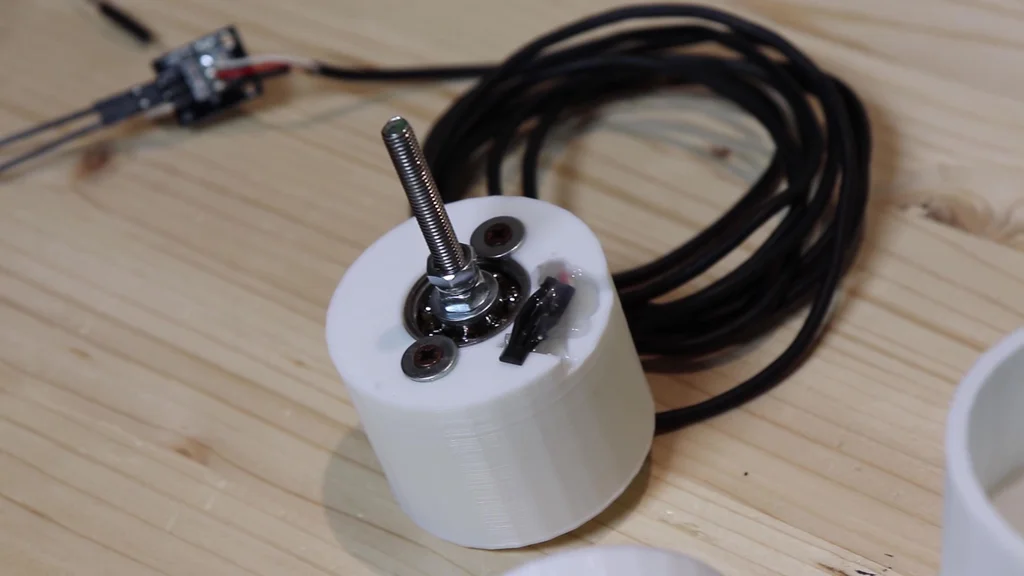
below you can find the STL files. The anemometer is composed of the base and
the rotating part. For the rotating part, the cups and the center piece are
printed separately and assembled with 3 screws. Inside the anemometer there
is a magnetic hall sensor on the base and a magnet on the rotating part. The
sensor sends out an impulse at each revolution. From the revolutions per
minute we can calculate the wind speed, but at the moment I don't know what
number I have to multiply the revolutions per minute by to get km/h. If
someone knows how to calculate it, please write those calculations in the
comments below. By what I found online, a rough (an probably wrong)
estimation is to multiply the rpm by 0,18.
Now comes the anemometer. I already talked about this in a video last year,
which you can find here. I also made the anemometer with the 3D printer, and
below you can find the STL files. The anemometer is composed of the base and
the rotating part. For the rotating part, the cups and the center piece are
printed separately and assembled with 3 screws. Inside the anemometer there
is a magnetic hall sensor on the base and a magnet on the rotating part. The
sensor sends out an impulse at each revolution. From the revolutions per
minute we can calculate the wind speed, but at the moment I don't know what
number I have to multiply the revolutions per minute by to get km/h. If
someone knows how to calculate it, please write those calculations in the
comments below. By what I found online, a rough (an probably wrong)
estimation is to multiply the rpm by 0,18.
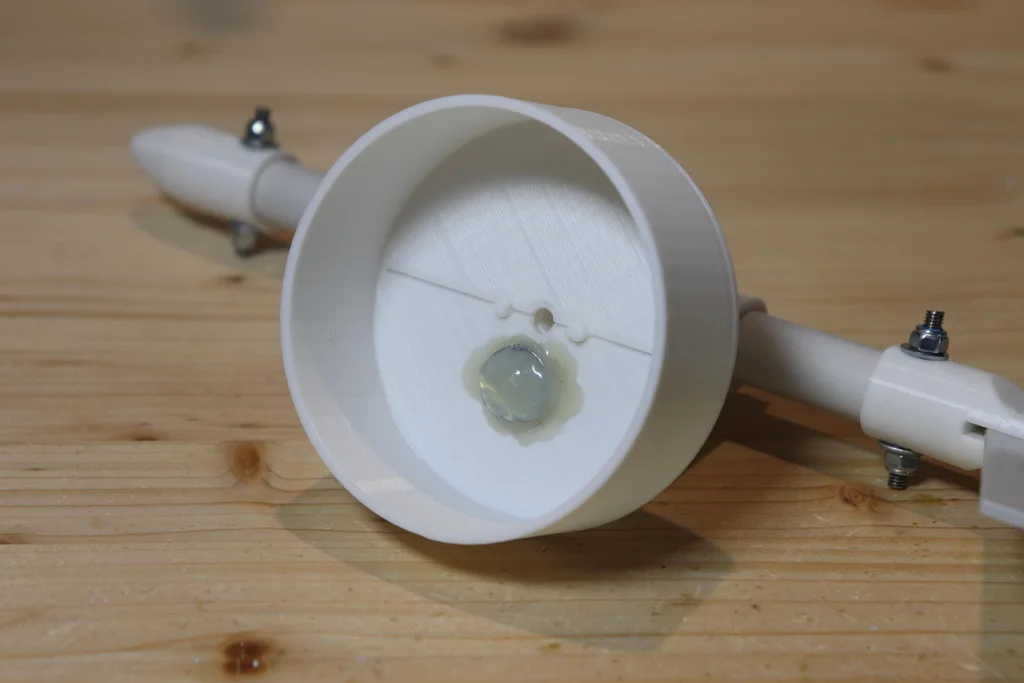
Step 4: Rain Gauge
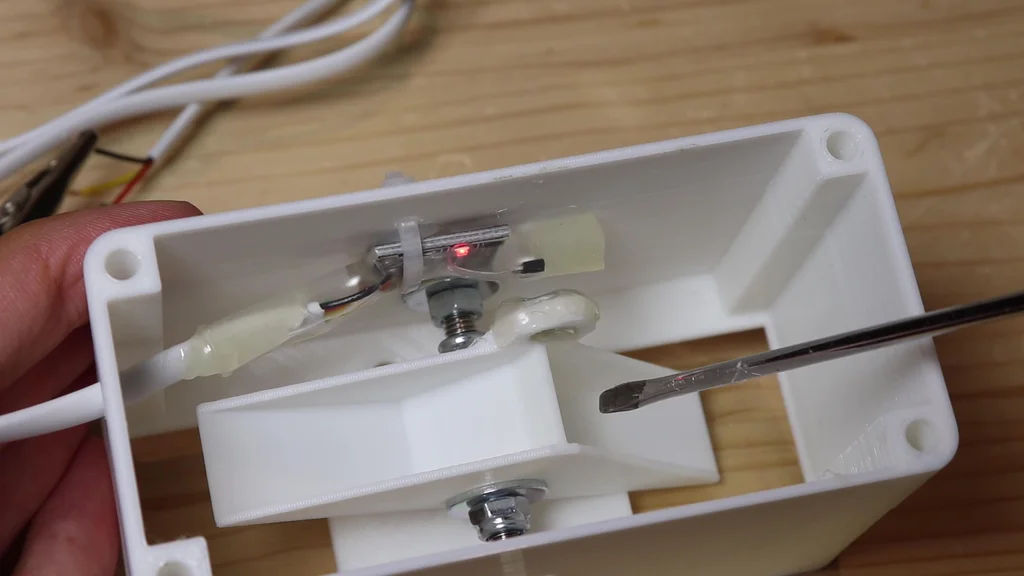
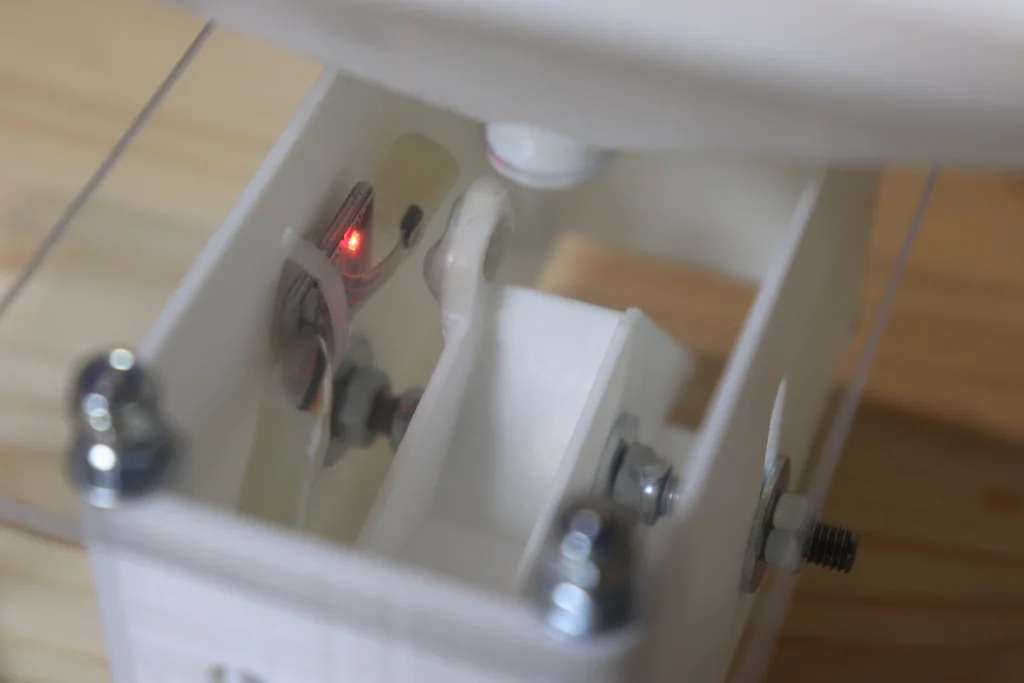 Lastly, there is the rain gauge. I showed this in a previous Instructable,
so you can find all the details there, including the 3D printable files.
However, this also uses a magnetic sensor, and each change of state of the
sensor means that a certain amount of water has passed through. The rain is
measured in mm of height.
Lastly, there is the rain gauge. I showed this in a previous Instructable,
so you can find all the details there, including the 3D printable files.
However, this also uses a magnetic sensor, and each change of state of the
sensor means that a certain amount of water has passed through. The rain is
measured in mm of height.
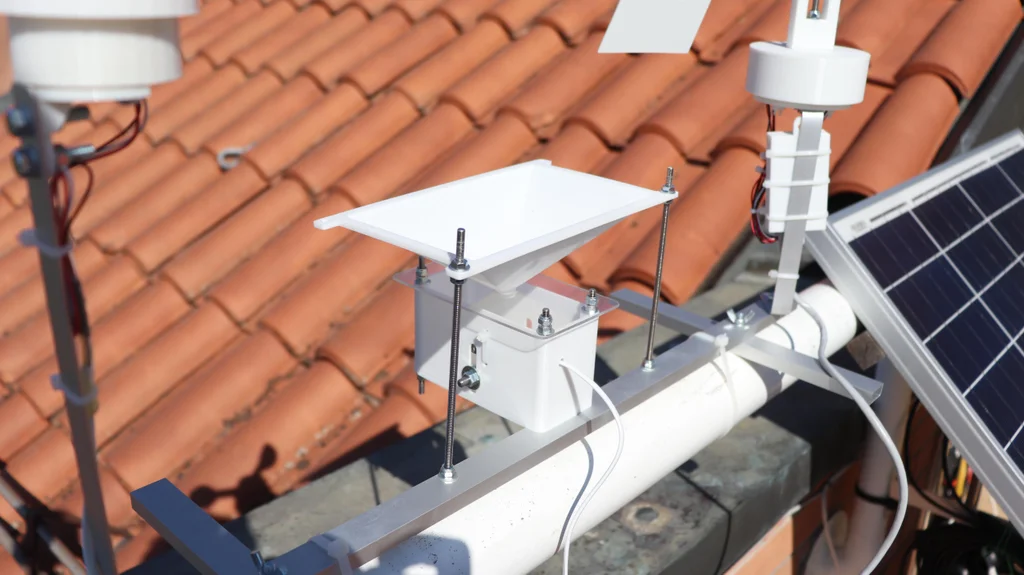
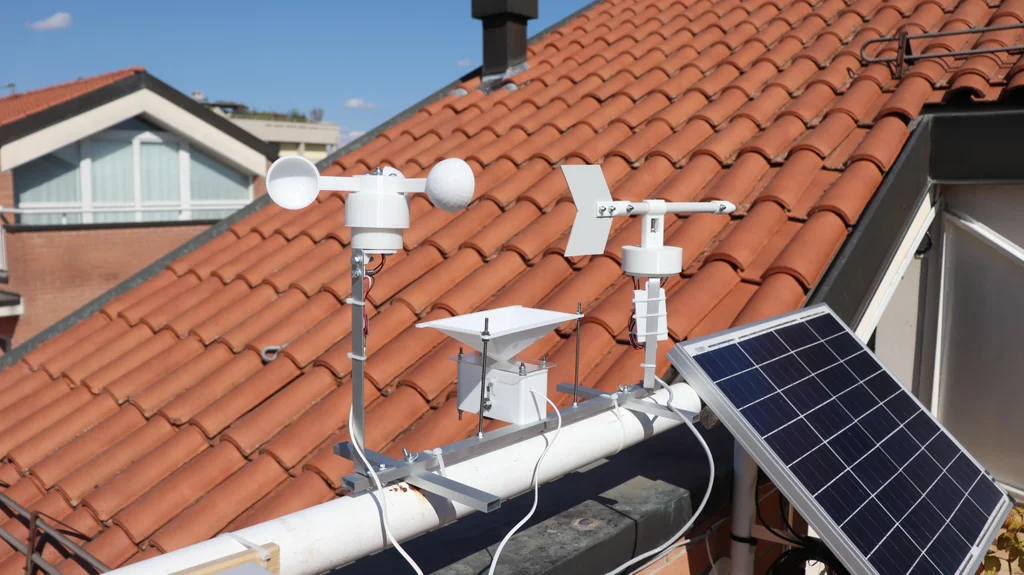
Step 5: Aluminium Frame
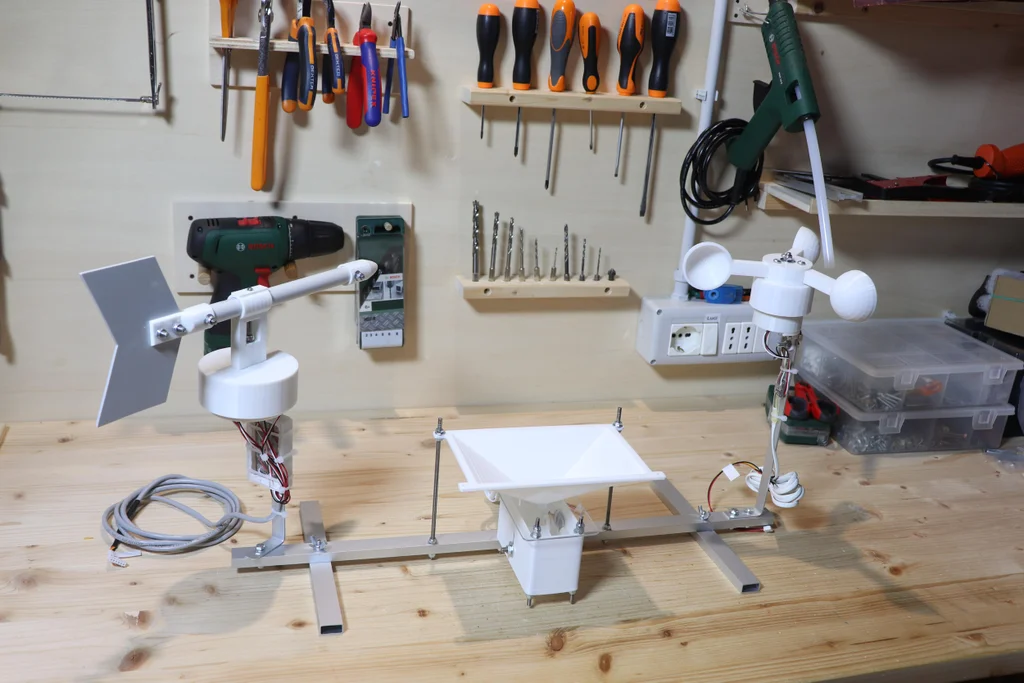
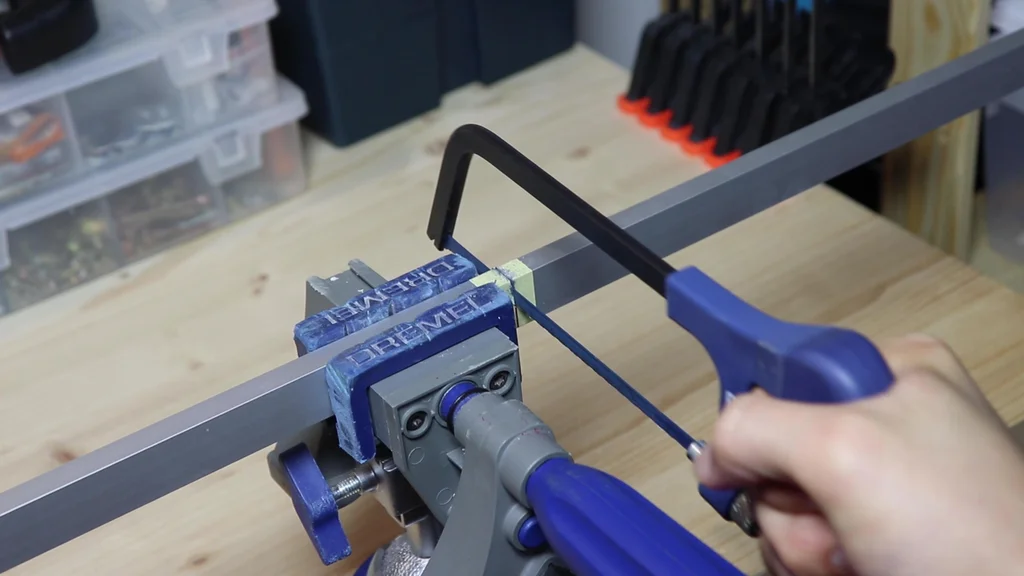
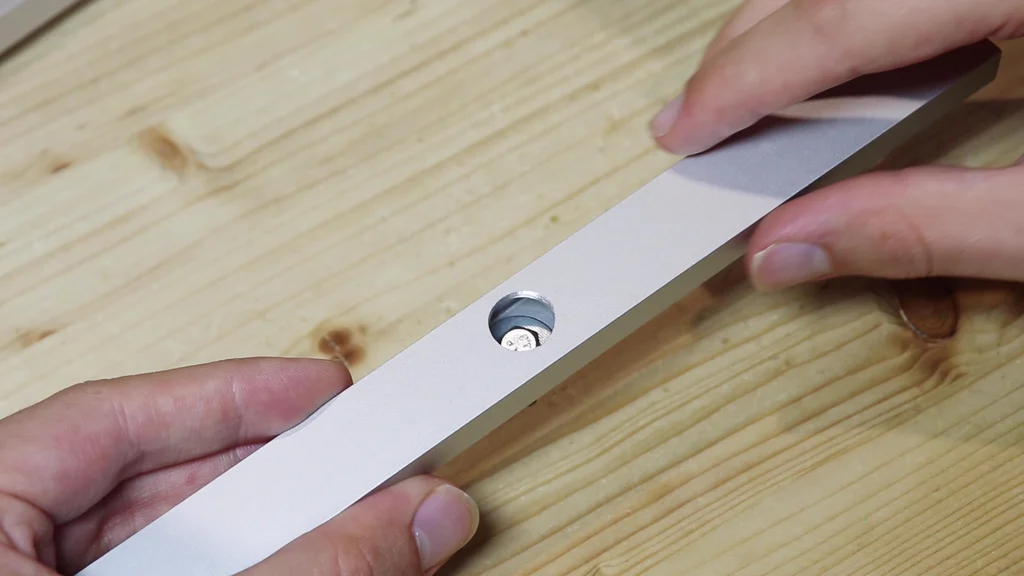
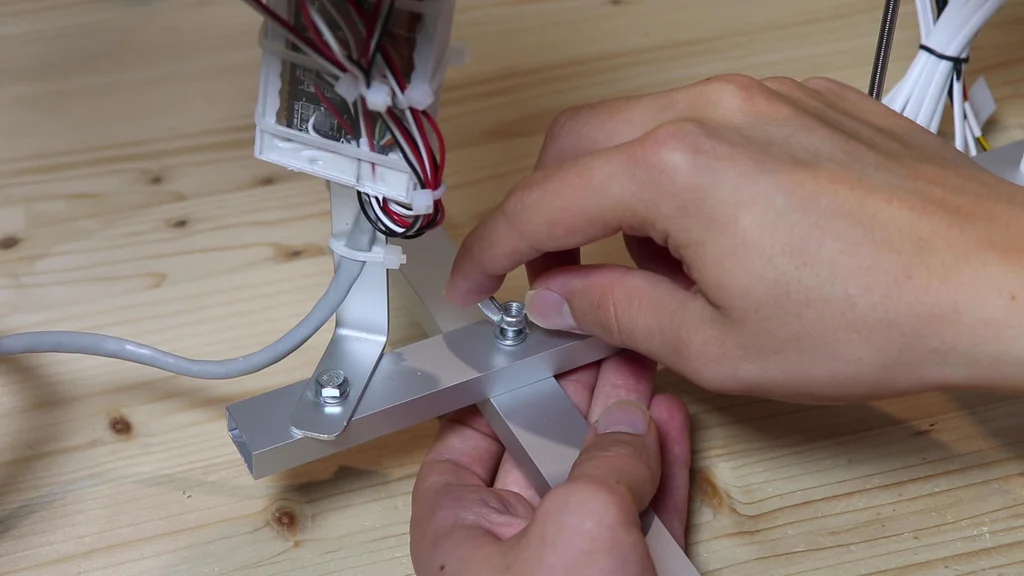
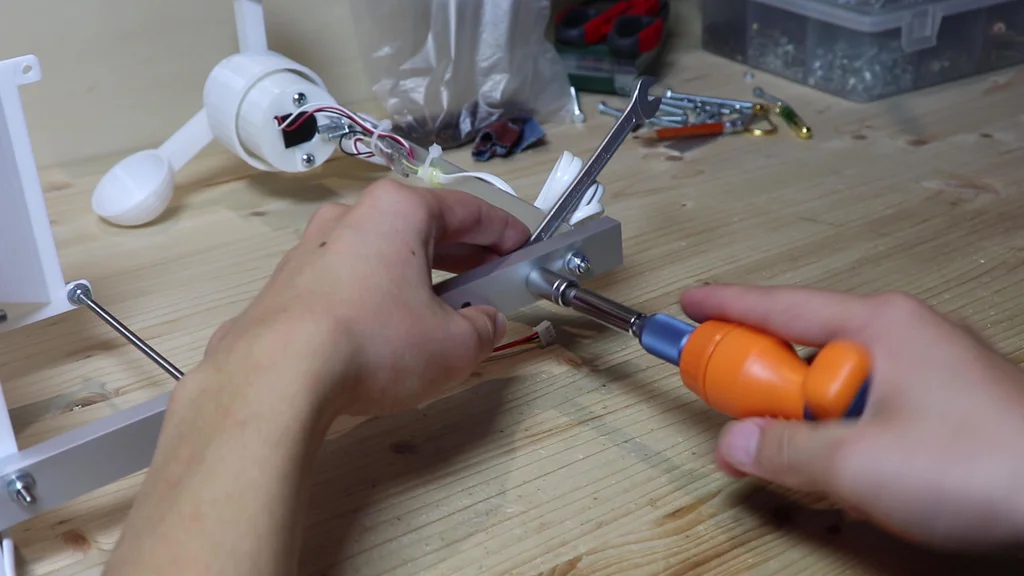 To make it easier to mount the weather station in it's final collocation, I
will put the various sensors on a single structure. To make it, I used a
rectangular aluminium profile. In the centre I fixed the rain gauge, and on
the two sides I put the anemometer and the wind vane. To hold everything up
I cut two more pieces of aluminium profile. On one side of them I made this
nice big hole, which allows me to fix them without having the bolt sticking
out underneath. After bolting everything togheter, this is the result. This
step is optional, because if you want you can mount the single sensors on a
structure you already have, for example the side of a roof.
To make it easier to mount the weather station in it's final collocation, I
will put the various sensors on a single structure. To make it, I used a
rectangular aluminium profile. In the centre I fixed the rain gauge, and on
the two sides I put the anemometer and the wind vane. To hold everything up
I cut two more pieces of aluminium profile. On one side of them I made this
nice big hole, which allows me to fix them without having the bolt sticking
out underneath. After bolting everything togheter, this is the result. This
step is optional, because if you want you can mount the single sensors on a
structure you already have, for example the side of a roof.
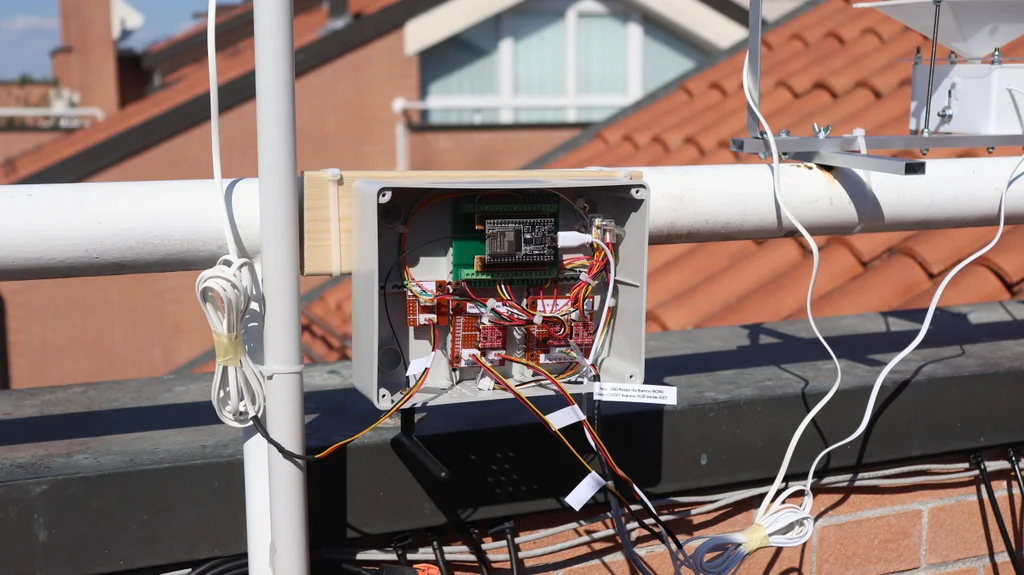
Step 6: Electronics and Pressure Sensor
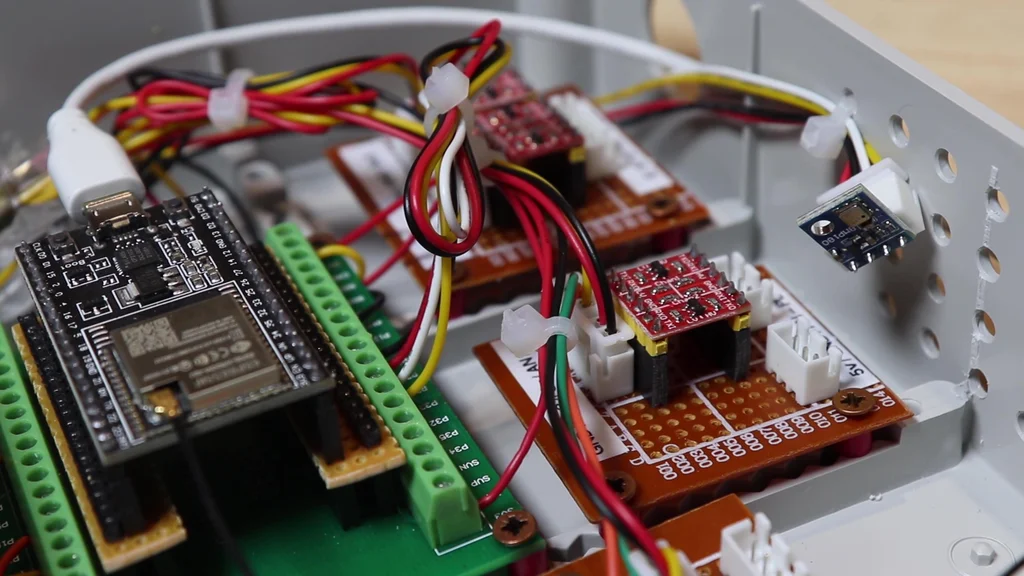
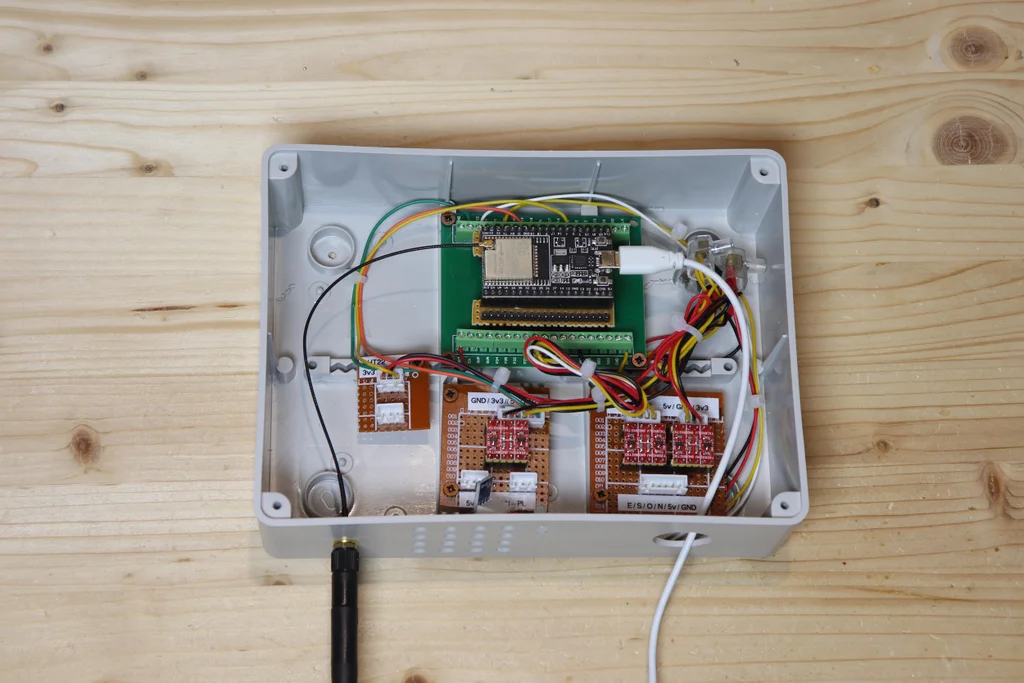 But now we have all the electronics, which will be in this junction box. To
make the connections easier, I bought this board that carries the ESP32 pins
on terminals. I don't know why, but my ESP32 doesn't fit on this board. So I
had to make adapters with a perfboard to move the pins. I screwed the ESP32
in the box, and on the underside I put the antenna for the WiFi connection.
I almost forgot about the atmospheric pressure sensor, which is the BMP180.
I put it here in the box, and to let the air pass through I made this grid
on the underside. This sensor communicates via i2c, so it needs two wires to
connect to the ESP32, other than 3,3v and GND.
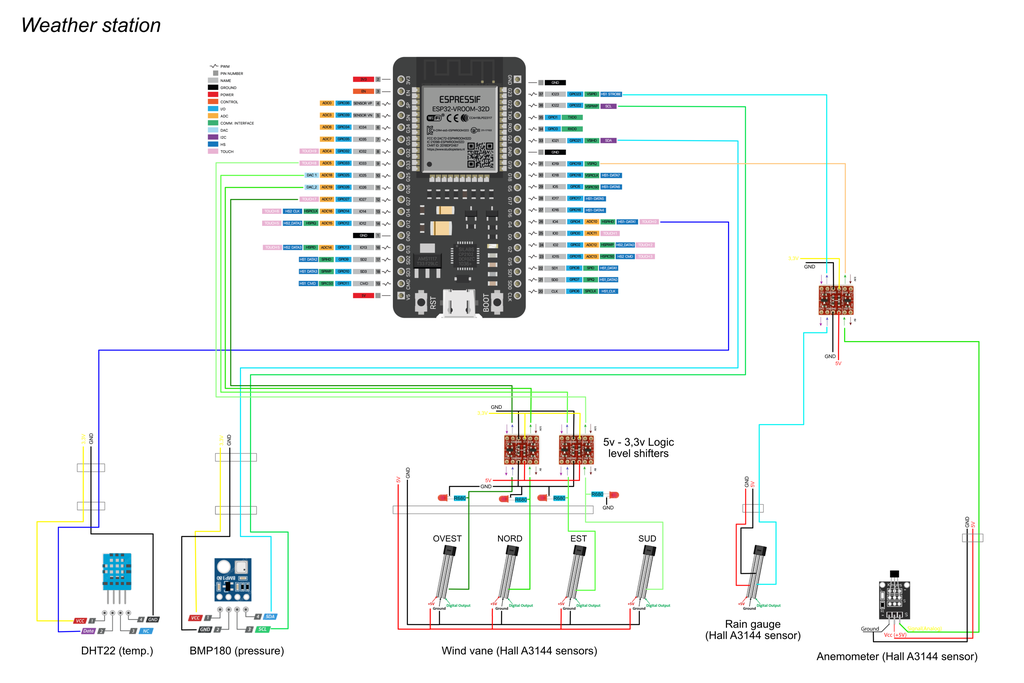
Now we have all the other sensors coming in here with their wires. The
temperature sensor has only one signal wire, and it connects directly to an
ESP32's pin. The problem are the hall sensors of the anemometer, rain gauge
and wind vane, which operate at 5v, while the ESP32 operates at 3.3v. So to
convert the signal from 5v to 3.3v I will use some level converters, like
these. To make everything neater, I soldered them onto perfboards. To make
the connections between the boards and the ESP32 I used JST connectors,
which are more solid than classic jumpers. Finally, I joined together the
wires for gnd, 5v and 3.3v, and tidied up the wires with cable ties.
Above you can find the schematics for all the electrical connections for the
sensors.
But now we have all the electronics, which will be in this junction box. To
make the connections easier, I bought this board that carries the ESP32 pins
on terminals. I don't know why, but my ESP32 doesn't fit on this board. So I
had to make adapters with a perfboard to move the pins. I screwed the ESP32
in the box, and on the underside I put the antenna for the WiFi connection.
I almost forgot about the atmospheric pressure sensor, which is the BMP180.
I put it here in the box, and to let the air pass through I made this grid
on the underside. This sensor communicates via i2c, so it needs two wires to
connect to the ESP32, other than 3,3v and GND.
Now we have all the other sensors coming in here with their wires. The
temperature sensor has only one signal wire, and it connects directly to an
ESP32's pin. The problem are the hall sensors of the anemometer, rain gauge
and wind vane, which operate at 5v, while the ESP32 operates at 3.3v. So to
convert the signal from 5v to 3.3v I will use some level converters, like
these. To make everything neater, I soldered them onto perfboards. To make
the connections between the boards and the ESP32 I used JST connectors,
which are more solid than classic jumpers. Finally, I joined together the
wires for gnd, 5v and 3.3v, and tidied up the wires with cable ties.
Above you can find the schematics for all the electrical connections for the
sensors.
Step 7: Home Assistant
 Home Assistant
The weather station will be connected to Home Assistant, which is a kind of
local server for controlling the various home automation devices we have in
our home. Home Assistant can be run on a Raspberry Pi or on a computer on a
Virtual Machine, like I do. To connect the weather station to Home Assistant
I will use ESPhome, which allows you to connect the ESP32 to Home Assistant.
After setting everything up, I can see the weather station data in real
time, either from the web page or the app. In addition, the data is
recorded, and I can also see graphs of the long-term trend.
Home Assistant
The weather station will be connected to Home Assistant, which is a kind of
local server for controlling the various home automation devices we have in
our home. Home Assistant can be run on a Raspberry Pi or on a computer on a
Virtual Machine, like I do. To connect the weather station to Home Assistant
I will use ESPhome, which allows you to connect the ESP32 to Home Assistant.
After setting everything up, I can see the weather station data in real
time, either from the web page or the app. In addition, the data is
recorded, and I can also see graphs of the long-term trend.
Step by step:
- Install Home Assistant on a Raspberry or on a computer with a Virtual
Machine, if you haven't already done it (there are many tutorials online for
the different systems)
- From the official add-on store, install ESPhome
- Add a new device in ESPhome and select ESP32
- In the space for the ESPhome code, paste the following code after the one
provided by ESPhome, and insert wifi ssid and password where needed
i2c:
sda: 21
scl: 22
scan: true
id: bus_a
sensor:
- platform: dht
pin: 4
temperature:
name: "Temperatura esterna"
humidity:
name: "Umidità esterna"
update_interval: 10s
- platform: pulse_counter
pin: 23
count_mode:
rising_edge: INCREMENT
falling_edge: INCREMENT
unit_of_measurement: 'mm'
name: 'Pioggia istantanea'
filters:
- multiply: 0.173
total:
unit_of_measurement: 'mm'
name: 'Pioggia'
accuracy_decimals: 3
filters:
- multiply: 0.173
update_interval: 5s
- platform: bmp085
temperature:
name: "Temperatura centralina"
pressure:
name: "Pressione esterna"
update_interval: 10s
- platform: pulse_counter
pin: 19
unit_of_measurement: 'Km/h'
name: 'Velocità del vento'
filters:
- multiply: 0.18
update_interval: 5s
- platform: uptime
name: Uptime
binary_sensor:
- platform: gpio
pin: 33
name: "Vento direzione NORD"
- platform: gpio
pin: 25
name: "Vento direzione OVEST"
- platform: gpio
pin: 26
name: "Vento direzione SUD"
- platform: gpio
pin: 27
name: "Vento direzione EST"
- Click install and on plug into computer, and connect the ESP32 to the
computer with the micro usb cable
- Follow the instructions on screen to install the code on the ESP32
Step 8: Wind Vane Configuration
 Wind Vane Configuration
The wind vane gives the states of the four sensors separately as binary
sensors (on or off). To convert these four values to a more esay to read
format (e.g. north or south-west) we have to create a custom sensor in Home
Assistant. There is some code but it is very esay.
Wind Vane Configuration
The wind vane gives the states of the four sensors separately as binary
sensors (on or off). To convert these four values to a more esay to read
format (e.g. north or south-west) we have to create a custom sensor in Home
Assistant. There is some code but it is very esay.
- To create the custom sensor, we have to edit the configuration.yaml fiel
- For that we need to have the file editor plugin installed or something
equivalent
- Paste the following code under sensor:
sensor:
- platform: template
sensors:
direzione_vento:
friendly_name: Wind direction
value_template: >-
{% if states('binary_sensor.vento_direzione_ovest') == 'off' and
states('binary_sensor.vento_direzione_nord') == 'off' %}
NORTH-WEST
{% elif states('binary_sensor.vento_direzione_est') == 'off' and
states('binary_sensor.vento_direzione_nord') == 'off' %}
NORTH-EAST
{% elif states('binary_sensor.vento_direzione_ovest') == 'off' and
states('binary_sensor.vento_direzione_sud') == 'off' %}
SOUTH-WEST
{% elif states('binary_sensor.vento_direzione_est') == 'off' and
states('binary_sensor.vento_direzione_sud') == 'off' %}
SOUTH-EAST
{% elif states('binary_sensor.vento_direzione_nord') == 'off' %}
NORTH
{% elif states('binary_sensor.vento_direzione_est') == 'off' %}
EAST
{% elif states('binary_sensor.vento_direzione_sud') == 'off' %}
SOUTH
{% elif states('binary_sensor.vento_direzione_ovest') == 'off' %}
WEST
{% endif %}
- Then, check the configuration and if it's valid reboot Home Assistant.
Step 9: Rain Gauge Configuration
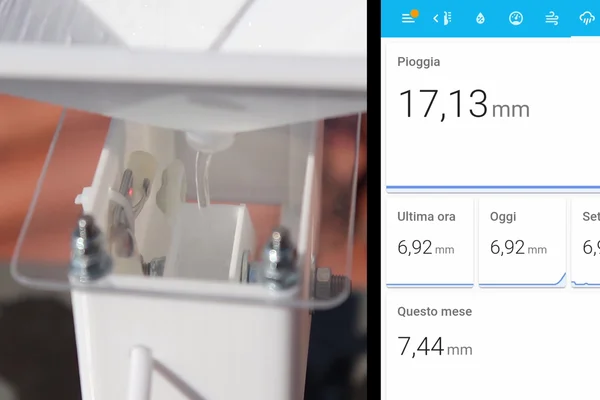
 Rain Gauge Configuration
The rain gauge sends via ESPhome the total of rain, which increases at every
step. If the ESP32 is rebooted, this value goes to zero. So, to have a value
that can only increase and that reset when a certain amount of time has
passed, we can use a utility meter, which is provided by Home Assistant.
With that we can show in the dashboard the total rain, the rain of that day
and so on.
Rain Gauge Configuration
The rain gauge sends via ESPhome the total of rain, which increases at every
step. If the ESP32 is rebooted, this value goes to zero. So, to have a value
that can only increase and that reset when a certain amount of time has
passed, we can use a utility meter, which is provided by Home Assistant.
With that we can show in the dashboard the total rain, the rain of that day
and so on.
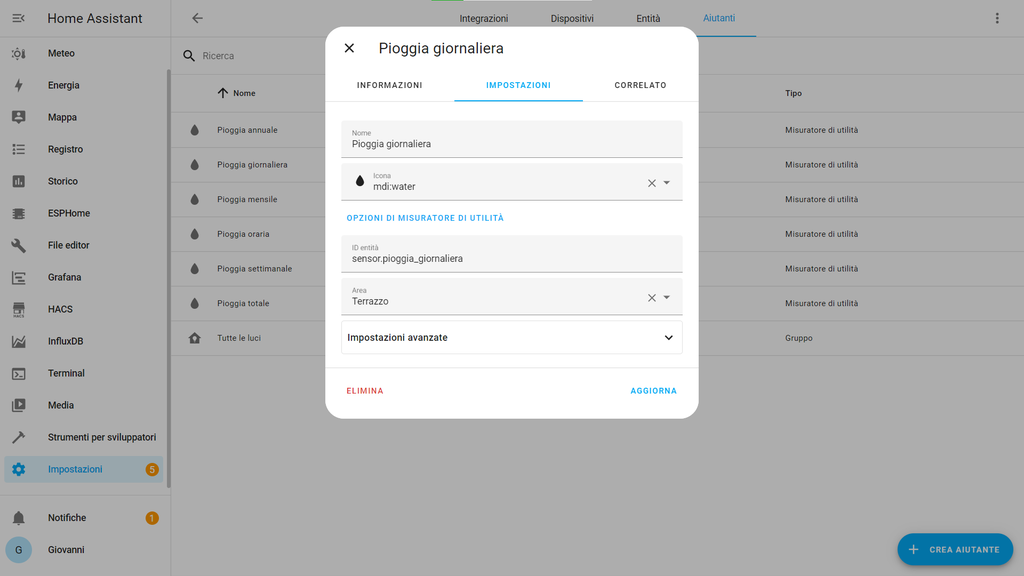
- Go to devices and then helpers
- Create a new hepler and select utility meter
- Select the rain gauge entity and insert the name of the conuter
- Select every how much time reset the counter (e.g. 24h or 1 month)
Create other counters for every time interval you want to show the amount of
rain for.
Step 10: Dashboard
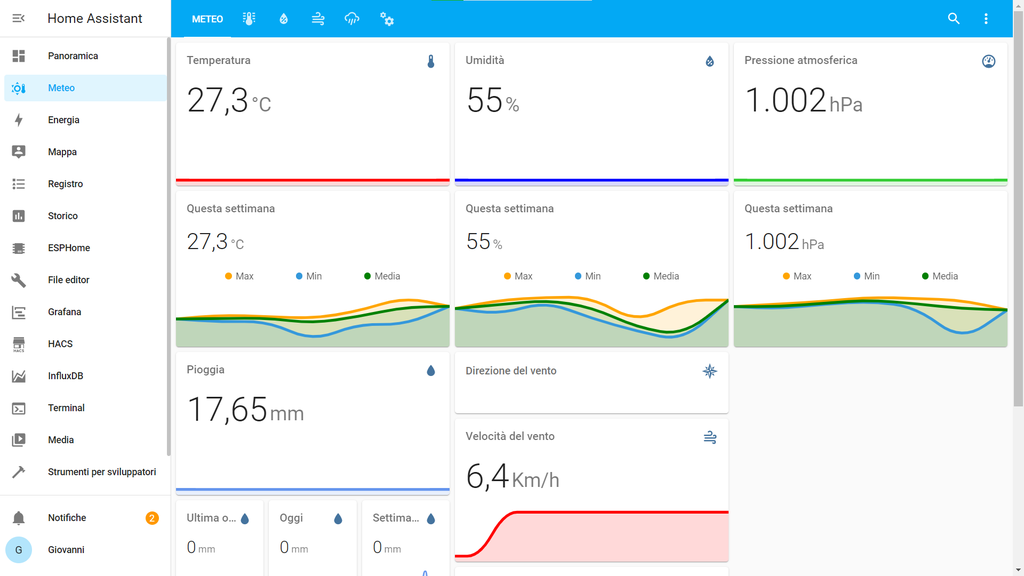
 Dashboard
Once the weather station is finally online, we can create the custom
dashboard to show the sensors readings and graphs. For graphs I suggest to
use the mini graph card integration, which can be installed via the Home
Assistant Community Store. At the top you can find a screenshot of my
dashboard, if you want to get ideas for your dashboard. Below i uploaded the
code file of my dashboard, if you want to edit it via the text editor.
To record the data you can configure a database in Home Assistant (recorder
integration). I haven't posted details on how to configure it because I'm
still learing a lot about Home Assistant and I haven't finished configuring
it.
To see the data from your smartphone you can download the Home Assistant
app. To connect from outside the local network I'm using the Nabu Casa
Cloud, which is the simplest solution but it's not free. There are other
solutions but they are not totally safe.
Attachments
download {{ file.name }}Dashboard.txt
Dashboard
Once the weather station is finally online, we can create the custom
dashboard to show the sensors readings and graphs. For graphs I suggest to
use the mini graph card integration, which can be installed via the Home
Assistant Community Store. At the top you can find a screenshot of my
dashboard, if you want to get ideas for your dashboard. Below i uploaded the
code file of my dashboard, if you want to edit it via the text editor.
To record the data you can configure a database in Home Assistant (recorder
integration). I haven't posted details on how to configure it because I'm
still learing a lot about Home Assistant and I haven't finished configuring
it.
To see the data from your smartphone you can download the Home Assistant
app. To connect from outside the local network I'm using the Nabu Casa
Cloud, which is the simplest solution but it's not free. There are other
solutions but they are not totally safe.
Attachments
download {{ file.name }}Dashboard.txt
Step 11: Done!
 This project is done, and I hope you found it interesting. Of course, you
can also build some of the sensors and not all of them. If you have any
questions, write them here in the comments. If you want to see more details,
please check the video that you can find at the top or here. It is in
Italian, but don't worry, it has also english subtitles. Thanks a lot for
reading my guide, bye!
This project is done, and I hope you found it interesting. Of course, you
can also build some of the sensors and not all of them. If you have any
questions, write them here in the comments. If you want to see more details,
please check the video that you can find at the top or here. It is in
Italian, but don't worry, it has also english subtitles. Thanks a lot for
reading my guide, bye!